Marginal ROA vs. Bottom-line ROA – Both Metrics Are Valuable
December 2, 2020
6 minute read – Many financial institutions are preparing for earnings pressure to continue in 2021. Short-term rates near zero and record low long-term rates are squeezing net interest margins. Gains on mortgage sales have helped, but that level of income can’t continue forever. Understanding where your financial structure is making money, losing money, or is breaking even will become even more important in this challenging environment.
Optimizing your position in the assets generating higher returns is one way to help offset margin pressure, but which should you look at? There are a couple of ways to evaluate profitability by category – marginal ROA and bottom-line ROA. The primary purpose of this blog is to introduce the concept of each. In a future blog, we will delve into how each can be used in optimizing today’s earnings while balancing interest rate risk.
In a nutshell, marginal ROA shows profitability without the institution’s overhead. Bottom-line ROA helps answer the question of whether or not loans and investments can cover their share of the overhead longer term. For purposes of this discussion, think of overhead as expenses that are not directly associated with a particular asset category.
Both metrics are valuable depending on your objectives.
Marginal ROA
Marginal ROA helps decision-makers understand and rank which asset categories contribute most to incremental profitability. This can help prioritize resources and marketing efforts, taking into account market demand for various loans. It can also be helpful in balancing pricing decisions with what the market will bear.
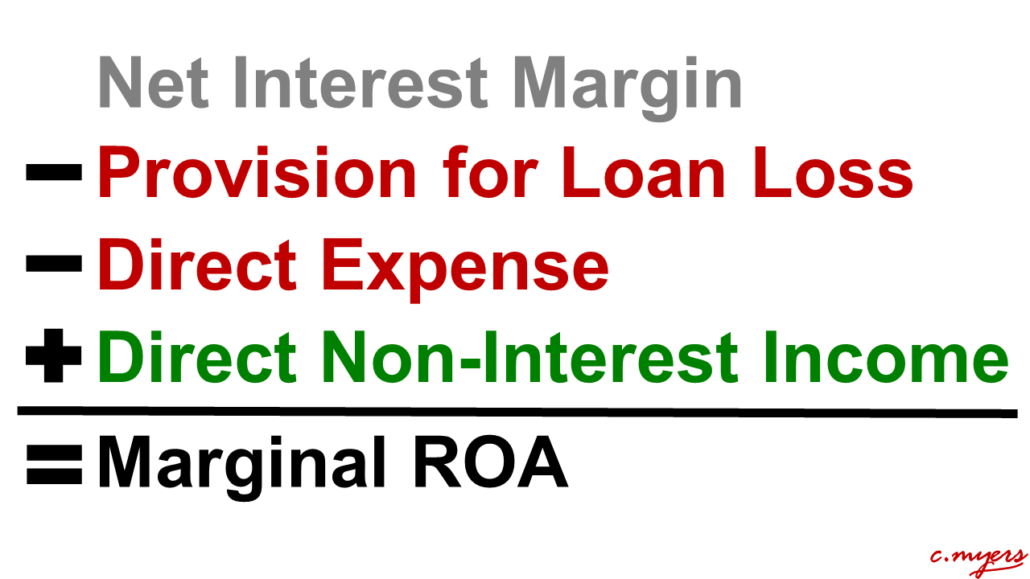
The marginal ROA calculation includes the net interest margin, direct expense, provision for loan loss, and direct income allocations by loan category.
If your institution has not done a cost study, consider using a proxy, or benchmark, for direct expense and direct income by category and then fine tune as you go. It is important to remember that this is art, not science. Understanding the concept and creating awareness around it is the critical first step.
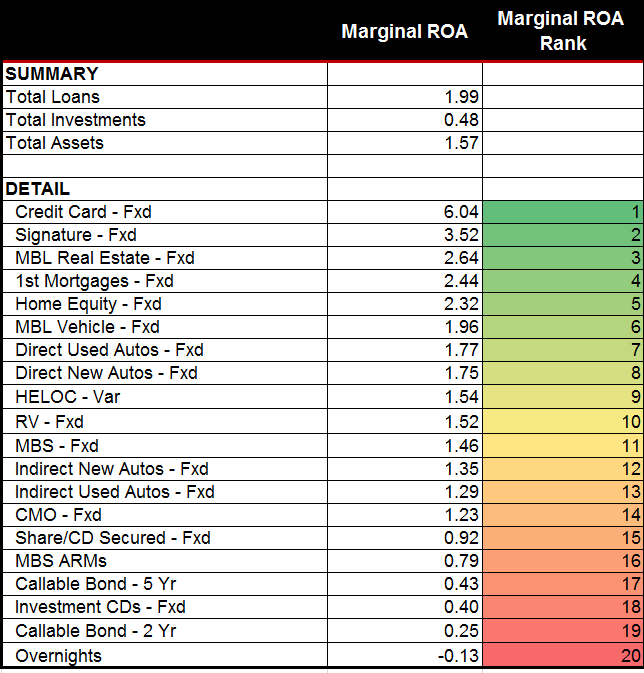
In the example below, the summary-level data at the top of the report shows the total marginal ROA contribution from loans and investments in aggregate. This summary view can help create more understanding of where profit is coming from before diving into the more detailed analysis.
The marginal ROA for each loan and investment is shown in rank order under the detail section of the report. This view can help non-financial people see a more comprehensive view, beyond just looking at yield.
There are numerous ways this decision information can be put to work. For example, the Credit Cards, Signature loans, and MBL Real Estate categories have the highest marginal ROAs, however demand may not be high. Seeing the contribution, decision-makers may discuss the cost/benefit of what it would take to create more demand. They may also look at the marginal contribution of higher demand loans and discuss alternatives to eke out a higher margin and/or pull through more of the loan applications they approve.
Note: The operating expense and non-interest income allocation benchmark is based on industry analysis performed by Kohl Analytics Group
Bottom-line ROA
Looking at marginal ROA can be beneficial as you evaluate incremental growth in specific asset categories. However, it is still important to evaluate from a bottom-line ROA perspective too.
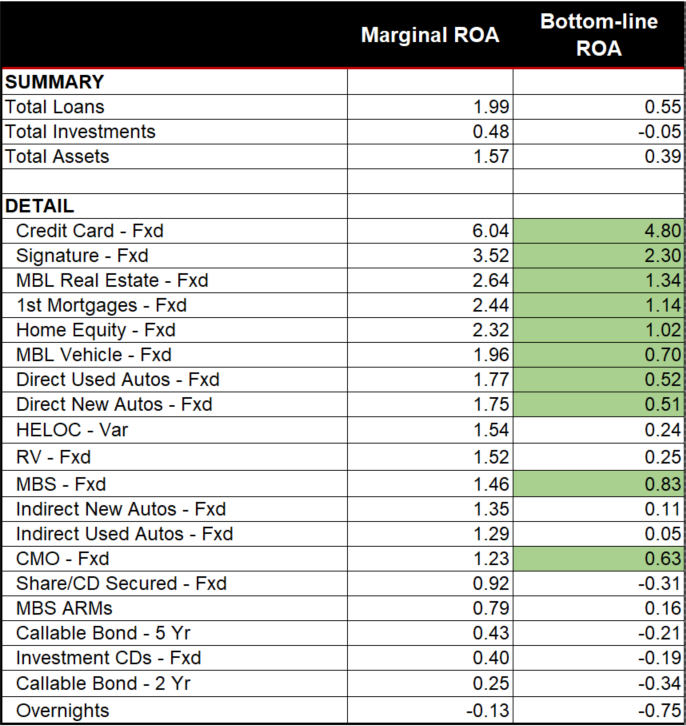
For example, decision-makers can quickly see how much could be earned by each asset type after covering overhead. It can help highlight if changes to the business model are needed, because it is easier to see the longer-term implications if the asset categories that are growing have a significantly lower contribution to earnings.
This can also help with pricing and efficiency prioritization decisions. If the marginal ROA is respectable, yet the bottom-line ROA plummets, relatively speaking, decision-makers have a better idea where to focus their efforts. Note in the table below that asset categories highlighted in green have a higher bottom-line ROA than total assets.
Note: The operating expense and non-interest income allocation benchmark is based on industry analysis performed by Kohl Analytics Group
There are a number of ways to use each metric to optimize your current earnings, balance interest rate risk, and remain competitive. As noted above, we will delve more into this in a future blog.


