3 Simple Things to Remember About Risk Limits
October 2, 2019
 Risk limits are intended to outline the sandbox you can operate in. They are intended to keep the institution safe by raising a red flag when the edges of the sandbox are breached. So it’s essential that the lines around the sandbox make sense and send a warning when the institution is wading into dangerous waters.
Net interest margin (NIM) volatility is a common basis for risk limits. It measures the percentage change in the net interest margin when market rates change. It’s important to understand that the ability of an institution to absorb interest rate risk depends not only on the net interest margin, but also on net operating expense (e.g., operating expense, provision for loan loss (PLL), and non-interest income).
Example 1 shows that applying a risk limit of 25% NIM volatility can allow some, like Institution 2, to have negative earnings while staying within the risk limit. It also shows that Institution 2’s high starting NIM allows a much larger decline in NIM than Institution 1. Consider that a common reason for high NIM is high credit risk. Higher credit risk is compensated for with higher loan rates, which increases NIM. There is a disconnect here because credit risk is not reflected in the NIM, it’s reflected in PLL. Therefore, bringing on more credit risk results in a higher NIM which results in allowing a larger decline in NIM.
Example 1
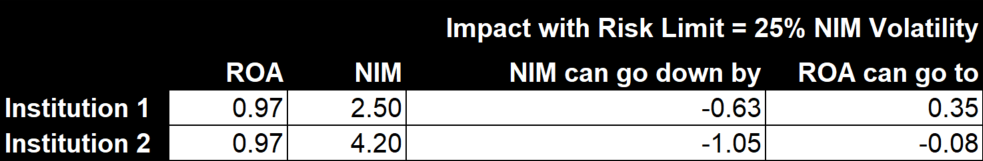
| Example 1: In June 2019, the average ROA for all credit unions in the US $500M+ was 0.97%. Net interest margins for those credit unions earning 0.95-1.00% ranged from 1.33% to 4.39%, illustrating that very different business models can generate similar earnings. Source: Callahan & Associates |
Example 2 shows two institutions that have the same NIM, but different ROAs. The risk limit allows the NIM to go down by the same amount for both institutions, but that can result in negative earnings for Institution 3. NIM volatility risk limits do not capture credit risk and could unintentionally encourage taking more interest rate risk. This approach masks risks that decision-makers need to see.
Example 2
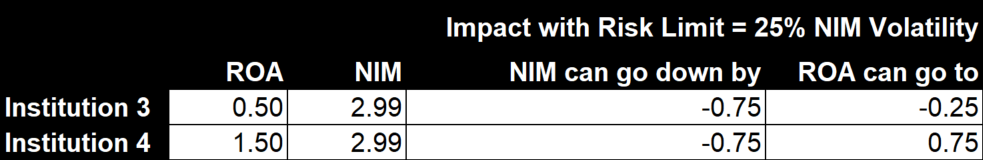
| Example 2: In June 2019, the average NIM for all credit unions in the US $500M+ was 2.99%. ROAs for those credit unions with NIMs of 2.95-3.00% ranged from 0.16% to 2.22%. Source: Callahan & Associates |
If net interest margin risk limits are viewed in a silo, unintended risk can be accepted. Risks and risk limits must connect to the business model. For example, institutions that have created efficient processes and realized lower operating expense ratios can build earnings and increase their ability to absorb interest rate risk without touching the NIM at all. When it comes to setting effective risk limits, remember these 3 simple things:
- Starting ROA matters when it comes to the ability to absorb risk
- Risk limits should not be viewed in isolation; they must connect to the bottom line
- A high net interest margin does not necessarily mean there is more room to take on interest rate risk
Interest rate risk is not represented by the volatility of the net interest margin alone. Although risk limits are put in place to protect net worth, some risk limits can unintentionally increase risks to net worth to unacceptable levels, so it’s important to view the structure as a whole when assessing risk.
