A Critical Step in Optimizing Your Balance Sheet
February 11, 2021
5 minute read – When optimizing earnings, choosing a range of environments to plan on is an important strategic decision for any leadership team. Focusing on a range of expected rates, rather than a single rate environment, can help leaders embrace uncertainty – expanding information and encouraging discussions on actions that can improve earnings across that range.
This can be a valuable shift in mindset, as it positions teams to be thinking through a variety of environments, rather than feeling they are betting on a particular environment. This also connects with the fact that different types of assets serve different purposes in your structure. Some do better when rates are low, some when rates are high, while others can be impacted by the yield curve. While not the focus of this discussion, it is also beneficial to test various levels of credit risk that could occur for the different types of assets.
We recently posted a blog that discussed the benefits of both marginal and bottom-line ROA for understanding profitability potential in a particular environment. This concept is then expanded across more environments when looking for insights to optimize the balance sheet. While each measure has its benefits, the examples below use marginal ROA.
The concept is to calculate the marginal ROA for each asset, in each rate environment that is in the expected range. Keep in mind that short and long-term rates can move by very different amounts, so you also won’t want to limit the view to just parallel rate changes. Ignoring yield curve shifts can result in missed opportunities.
While each environment within the range can be studied in isolation, it can also be an overwhelming amount of data, especially when incorporating various yield curves. A good step for the team is to evaluate and compare the average profit potential across all those environments.
Note: The following answers are for an example institution. It is important to understand the potential earnings and rankings for your institution.
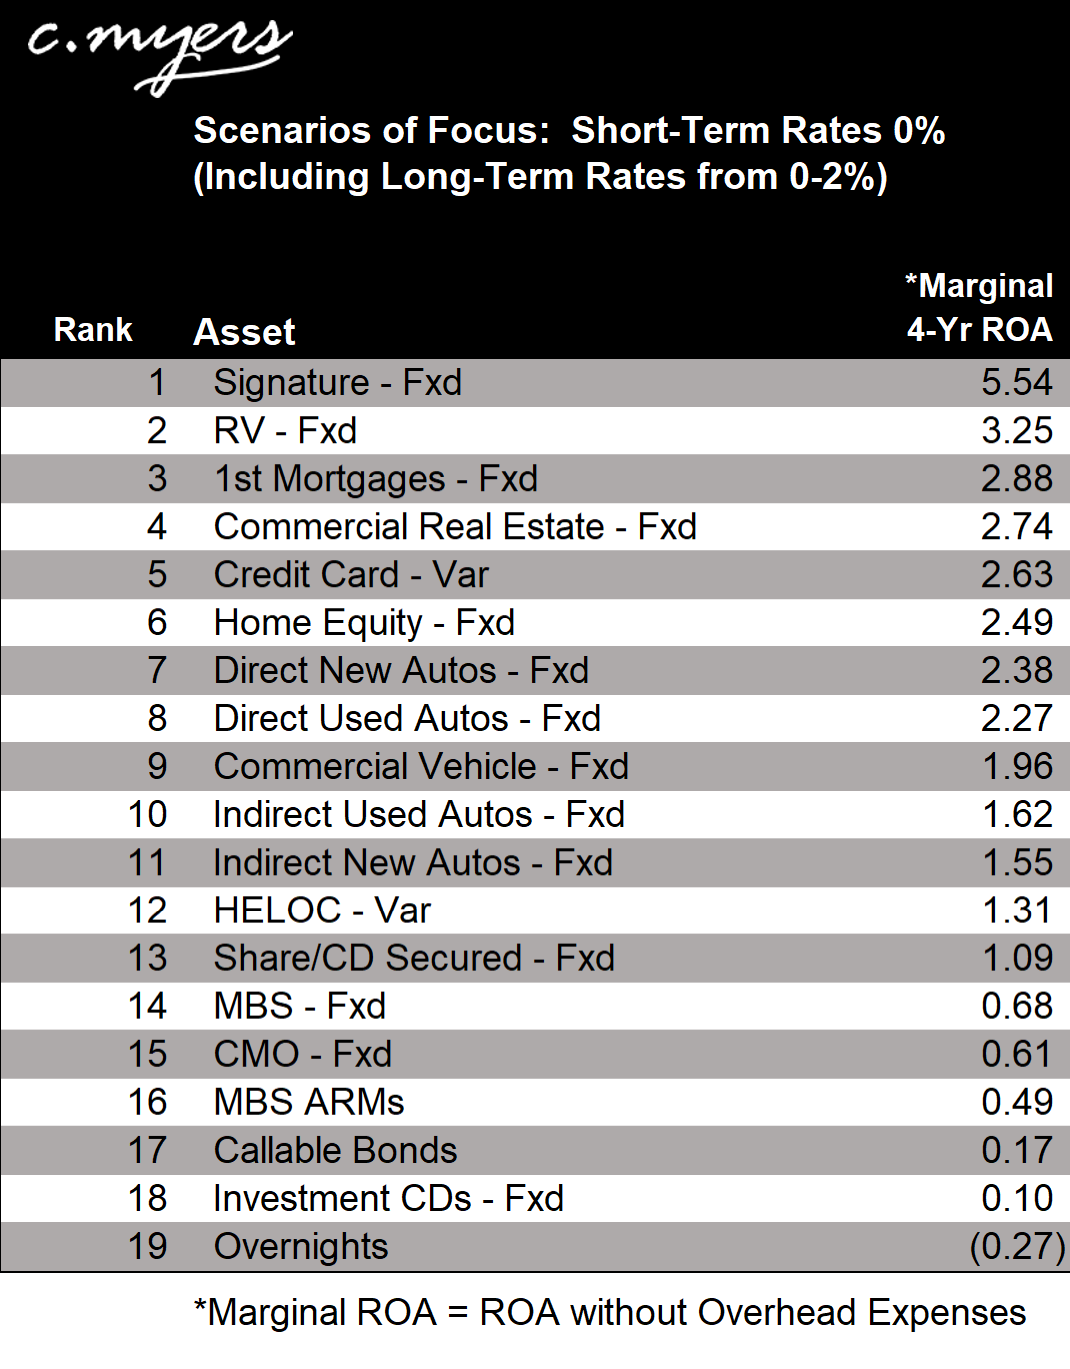
Team A: Expecting short-term rates to stay at 0%…
Let’s look at the results for a leadership team that expects short-term rates will stay around 0% and that long-term rates may range from 0-2%, over the next 4 years.
Team B: A good chance short-term rates may increase…
Next, are the results for a leadership team that sees reasons why rates may stay at 0%, but also sees potential for increase in inflation and other pressures that could result in higher rates. They expect short-term rates could be anywhere from 0% to 2% over the next 4 years. They also want to incorporate all the different levels of long-term rates that have occurred with those short-term rate levels.
For comparison purposes, we included arrows indicating how the ranking of categories would be different based on the chosen environments of focus.
Difference in focus
Here are some examples of how the two teams, with the same structure today, may have different priorities depending on the rate environments they are expecting.
- Credit Cards: Most financial institutions would like more credit cards, but Team B would place them as a higher priority, working more aggressively on pricing, rewards, payment options, and/or designs to increase their penetration
- Indirect Autos: Team A would focus more on increasing their balances of indirect autos over HELOCs
- Callables: Team A may shift investments from overnights to callable bonds to pick up yield in a 0% environment, but Team B views that callables don’t earn enough across their range of focus
- CMO-Fxd vs MBS ARMs: Team A would pick the fixed-rate CMOs, but evaluating the same fixed CMOs, Team B would prefer MBS ARMs
Dig deeper and prove it out
The answers in the tables are averages across the selected rate environments. The pattern of performance for each category is unique. If you are trying to choose between two categories that are close, compare the performance picture for all of the environments to see which may better fit gaps in the structure.
The purpose of these tables is to help accelerate thinking about the areas that can have the biggest improvement towards optimizing the structure. Prove out the desired changes through comprehensive simulations prior to finalizing decisions. This process also helps decision-makers see how the optimization changes they are contemplating can impact their overall structure and understand if they have the potential to bump up against risk limits in unexpected environments.
While there are many valuable conversations that can be had from this information, here are a few things to consider.
- What would it take to get just a 1% of assets increase in one of the top categories?
- While it is helpful to focus on the top categories, often there is more optimization gained by moving from bottom categories to those ranked in the middle
- For example: While many talk about wanting more credit cards, a movement of assets from the category ranked #4 to #2 has a smaller earnings impact than the same dollars moving from #18 to #8
- Additionally, it is often easier to move assets from the bottom to the middle as there can be materially more competition in top categories
- Which categories have room to accept a lower marginal ROA, if it leads to more volume? (Note: As discussed in previous blogs and c. myers live, there are typically options to improve volume that are not rate related)


