Avoid These Common Financial Misunderstandings With Your Board
August 14, 2024
|
|
4 minute read – Most Boards look for financial ratios and other measures of success to gauge their institution’s financial health and strategic progress, but many Board members don’t understand some of the nuances of the measures, especially when the dollars and the ratios appear to be telling different stories. Senior leaders are focused on sharpening their ability to communicate what’s really happening so the Board can see the situation clearly and focus on what’s most important.
Having observed hundreds of Boards and conducted financial education for many of them, we wanted to share some of our takeaways. Here are 3 points of confusion we’ve heard a lot about lately. Proactively explaining what’s happening can go a long way toward getting everyone on the same page.
1. Our losses are increasing too fast! Losses may be increasing faster than planned, but it’s important that other impacts to the ratios aren’t adding fuel to the fire. One source of confusion comes from changes in the denominator of the ratio – typically loans or assets – that can make the increases look worse than they are. It’s not unusual in today’s environment for loans or assets to shrink. The same dollars of losses will look worse with a smaller denominator. Don’t assume that all Board members are taking this into account when looking at losses as a percentage of loans or a percentage of assets. Pointing out what’s happening with the dollars and the ratios can help bring clarity.
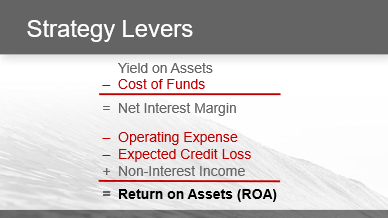
2. Why are operating expenses so high? Similar to loss ratios, operating expense ratios can show increases even when the dollars are decreasing due to shrinking asset size. Helping the Board to see the dollars and the annual percentage increases in the dollars along with the ratios provides a few different ways to interpret what’s happening. Of course, if asset size is decreasing, it’s still a valid question to ask whether operating expense dollars can continue to increase at planned levels or if it’s hurting profitability too much. Looking at how the other components of ROA, which we call strategy levers, are being affected can help with this discussion.
3. Why did this ratio jump so much? Year-to-date (YTD) ratios tend to cause confusion in the transition from 4th quarter to 1st quarter. YTD ratios can blunt the magnitude of change throughout the year. In times of rapid change, the 1st quarter YTD ratios will fairly represent the current ratios, but Boards need to be reminded that 4th quarter YTD numbers are not meant to represent the current ratios, rather they reflect the entire year’s performance, and Boards must be warned if a big jump is coming.
Some experienced this jarring shift in the Cost of Funds ratio after it had been on a steep climb. Looking forward, if the current escalation in Charge-Offs continues, it could create a big jump in the Charge-Offs ratio as 2024 turns to 2025.
Here’s an example of an institution experiencing declining ROA throughout the year. This is the YTD ROA each month. By December it dropped from 1.00% to 0.45%:
What will the following January look like when the YTD ratio “resets” to only include January? It turns out that the month-to-date (MTD) ROA was declining by 10 basis points each month. YTD ROA jumped from 0.45% in December down to -0.20% in January:
Preparing the Board for big changes ahead of time and explaining why YTD ratios may not be great indicators for the next year can help eliminate unnecessary surprises.
Helping Board members avoid confusion can lead to greater fluency around the concepts, a common understanding, and better alignment. The resulting focus on the true situation is a key step toward more productive conversations and better decisions.


