FinTechs vs. Traditional Lenders – Is There a Difference?
January 19, 2018
TransUnion recently released a study comparing FinTechs to other lenders, and used personal loans issued between 2014 and 2016 as the basis for the study. The study’s objective is to answer the question, “Are FinTechs different from other lenders?” Interestingly enough, this is a question credit unions have been speculating on for years in an effort to understand the new type of competition FinTechs are bringing to the industry and how to respond.
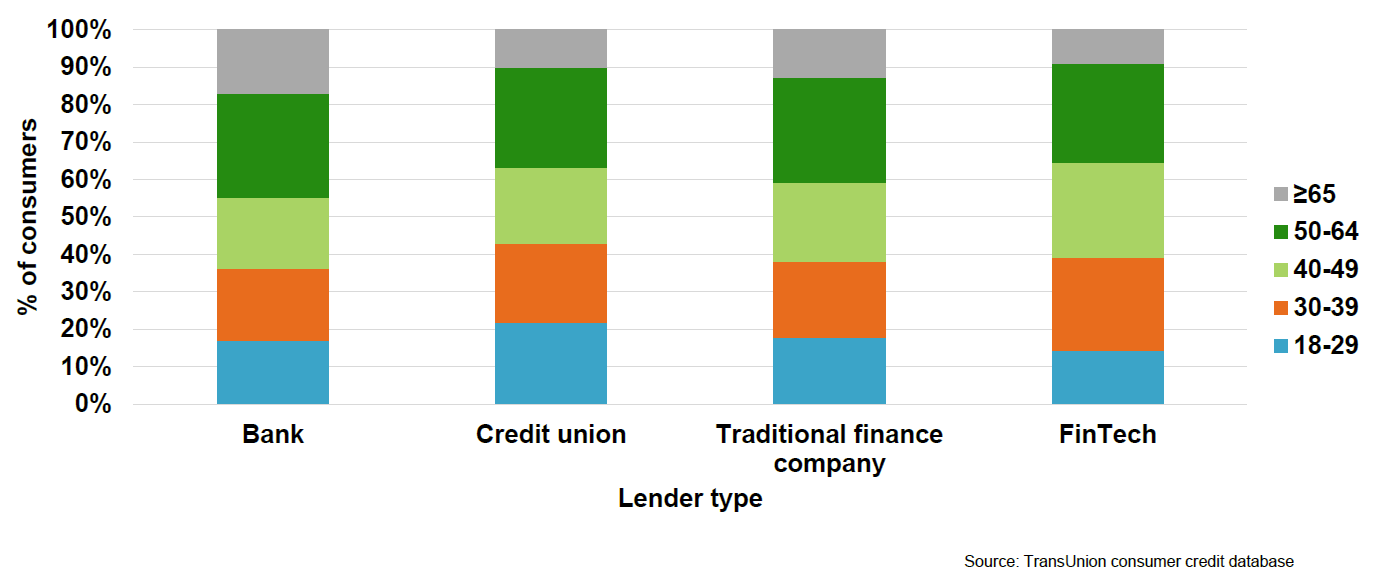
While the study contains a wealth of fascinating information, we are going to focus on two areas in this blog. The first is age distribution of consumers by lender type. Often, credit unions believe that FinTechs are more popular in the younger age demographics, as those age groups are likely more tech savvy and willing to bank in non-traditional ways – two of the main value propositions of FinTechs.
Surprisingly, the following graph indicates that credit unions do better in attracting the younger demographics than any of the lender types – including FinTechs. Where FinTechs shine is in the 30-64 age range, which is when most consumers are borrowing.
Table: Age Distribution of Consumers by Lender Type
This raises a number of questions for credit unions, some of which are:
- Why are credit unions attracting more 18-29 year olds?
- What sort of business are credit unions receiving from this group?
- Is the competition for the younger age demographic detracting from competing in the age demographics where consumers do most of their borrowing?
- If FinTechs often compete with traditional lenders on technology and non-traditional banking, why are they more successful with the 30-64 group compared to credit unions than the <30 age demographic?
Some of the answers may challenge credit unions, given the strategic focus and discussions about how to increase Millennial membership in recent years.
The second area of the study is on credit risk. There is often a question about how much credit risk FinTechs are willing to take, with the speculation that they are generally taking riskier loans. According to the study, the FinTechs’ approach to credit risk is more nuanced.
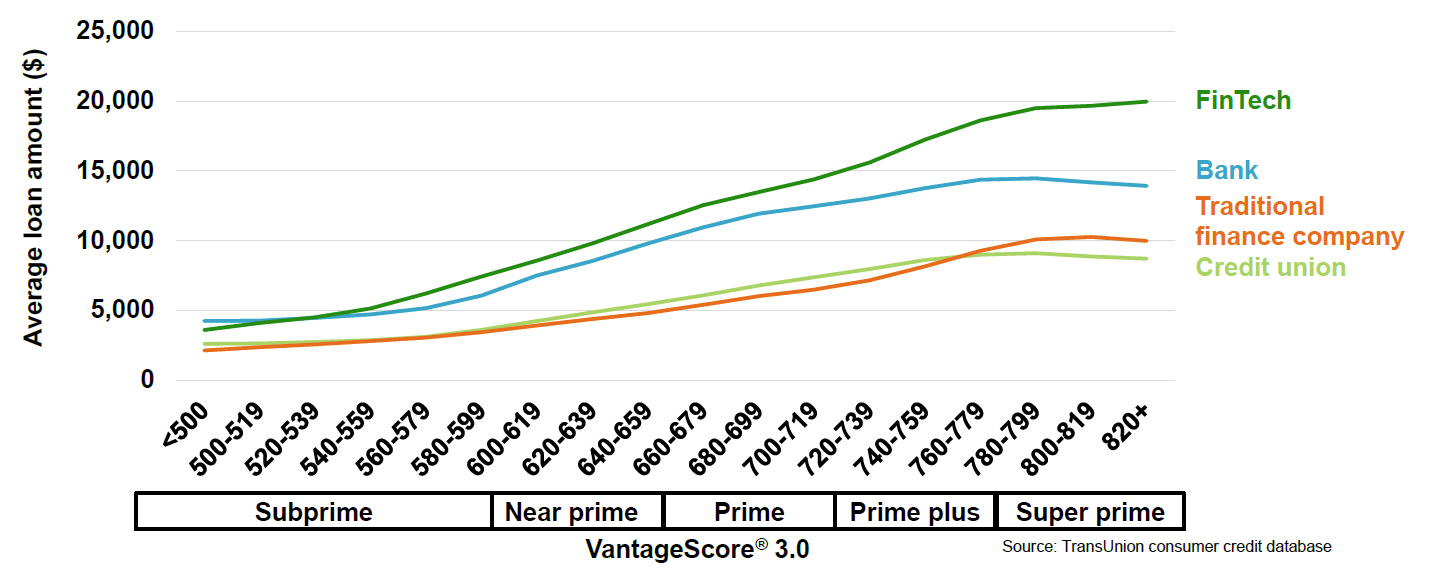
The chart below show that FinTechs are generally willing to lend more money to consumers. This does lead to more credit risk exposure, given the higher loan amount.
Table: Average New Loan Amount
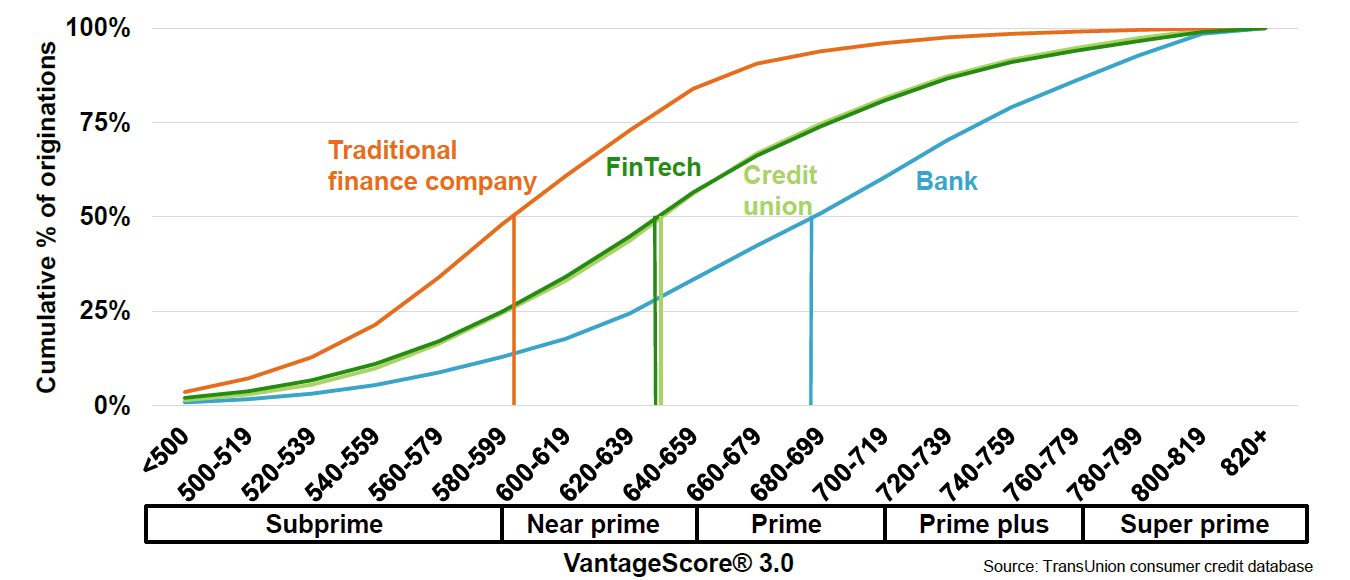
However, when looking at the distribution of originations by credit score, FinTechs’ credit risk is right in line with credit unions.
Table: Risk Distribution of Originations
In combination, these two charts suggest that while FinTechs are willing to lend more money, they are not focused only on the near prime and lower credit scores. This again may challenge credit unions’ view as it suggests competition from FinTechs is not isolated in the lower credit risk tiers and in fact, FinTechs are competing across all credit scores and age ranges.
In light of this information, it would be good for decision-makers to have strategic discussions about how this could impact the credit union and its strategy. This is a great topic to discuss during a board or ALCO meeting. Participants can read the study beforehand, and come ready to discuss the impacts – positive and negative – to the credit union, and consider if any changes to the credit union’s strategy need to be discussed.


