Posts

Observations from ALM Model Validations: For the Real Assumptions, Go to the Source

Do the assumptions outlined in your ALM model’s assumption summary line up with what is actually being utilized to calculate the results? In performing model validations, we have seen numerous instances in which there were discrepancies between reported assumptions and what was used in the actual reporting. This situation creates unnecessary challenges and makes it difficult for credit union staff or examiners to evaluate the reasonableness of the assumptions being utilized. Additionally, it can become much more difficult to understand the results and the changes in results.

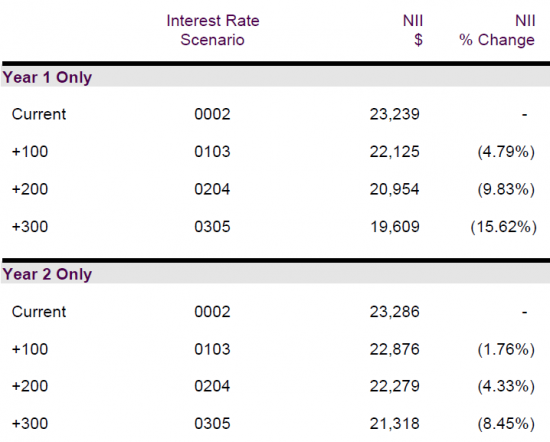
For example, in one validation the deposit maturity assumptions actually used in the simulation were roughly 2x as long as the assumptions reported in the assumptions summary report. In another validation, the assumed rate changes (betas) on deposits were different than reported in the summary pages.

Mistakes can happen but it is important to identify issues and correct them as quickly as possible. One of the best ways to do this is to go right to the source. If you do not have reports directly from the model that detail exactly which assumptions are being utilized, you should work with your ALM provider to receive them with each simulation. It is good to check the summary information against the model at least annually and any time there are changes in assumption methodology. Seeing what is actually in the model provides better oversight and helps to avoid the risk of someone unintentionally entering something incorrectly in a summary.

If You Think Changes in Payments Won’t Impact Your ALM and Interest Rate Risk Management―Think Again

, ,

There are bites – small and LARGE – being taken out of credit unions’ non-interest income. Just consider:

  • PINless PIN.
  • Apple Pay – or the pay option du jour (e.g., Bitcoin, Samsung Pay, etc.).
  • The increase in payments via ACH, including P2P.
  • The decline in ODP.

As these bites are being taken out of revenue, decisions will need to be made as to how to compensate for the loss, not to mention the additional expenses associated with managing multiple payment options for your members.

If credit unions are not willing to accept lower earnings, then viable options are to:

  • Generate other non-interest income that is not influenced by interest rates.
  • Generate new interest income by accepting additional credit risk, interest rate risk, or both.
  • Be fanatical about continuous process improvement to better manage expenses.

Many high-functioning credit unions are proactively digging deep into their risks to non-interest income. They are quantifying the bites – small and LARGE – and forecasting trends to understand, well in advance, the potential impact to income. Identifying these risks, long before they become an unfortunate reality, opens up many viable options for risk management and mitigation.

Decision-makers of high-functioning credit unions are then investing the time to have strategic discussions. These forward-thinking discussions help decision-makers make rational, in-depth, strategic decisions versus having a knee-jerk reaction if the risks become reality. If it becomes necessary to take on additional credit risk or interest rate risk, then it can be done in a deliberate manner allowing decision-makers adequate time to test additional risks in small, manageable increments.

History has proven that the point at which you address a problem is directly related to the number of viable and desirable options you have to solve it. Don’t wait to address this issue.

Observations from ALM Model Validations: Extremely Profitable New Business ROA in Static Balance Sheet Simulations

In this installment of our series on observations from model validations, we’ll focus in on the results from traditional income simulations, specifically static balance sheet simulations. We often see results that show low risk despite the credit union having a material amount of fixed-rate, long-term assets.

Take the example below which shows the NII results from a static balance sheet simulation. In year 1, the NII volatility is -15.62% in a +300 bp rate environment, which would be considered lower risk, and year 2 is even better at -8.45%. Keep in mind most policies have NII volatility limits of 20-30%, so this particular credit union looks pretty good. But why?

Static balance sheet showing NII volatility
While there could be a number of reasons, what we’ve found is that static balance sheet simulations assume the new business will always be extremely profitable if rates increase. The example below shows a credit union that has a base case ROA of 0.78% that jumps 153 bps to 2.31% in a +300 rate environment.

Static balance sheet simulation with new business ROA over 2{f36f94659acab79cca6adb0c2cb87abd9a89960d2b05b787f21b160005154717}

As we discussed in a previous blog, Observations from ALM Model Validations: Cost of Funds Back Testing, static balance sheet simulations assume that the deposit mix will not change as rates change, even though history suggests otherwise. It also generally assumes that a credit union could never have the loan-to-asset ratio drop, and often assumes the institution will be able to raise its loan rates 100% of the rate change.

Clearly, relying on a new business ROA north of 2% is not reasonable. These unrealistic assumptions about new business understate the risk of an institution.

Often when presented with this evidence, the response is that there is no way that such a high ROA is being assumed because the results show a decline in ROA for the first year (see example below). The reason is that often places only look out one year, maybe two. So the new business impacts the results but is smaller than the existing business.

To prove this out, look out at year 5 in your static simulation. You may not fully see the ROA over 2%, since most institutions are having the strain from their existing commitments holding the ROA back, but it is likely you will see an ROA that is above a level the credit union has ever experienced. If you want to see an even less defendable answer, look out at year 5 for a +500, and you will most likely see an ROA that far exceeds the earnings experienced the last time rates were at 5% (2006-2007).

Static balance sheet hiding critical new business assumption

Seeing results from this perspective, it is hard to call a static balance sheet a risk simulation.

Model Risk Management

,

Model risk involves the use of financial models, and the potential that errors in setup, input, or interpretation of results can lead to material misstatement of results. Model risk can be present in internally created financial models or in vendor-supplied financial models and/or results.

Having a model’s mathematics validated periodically (important only if there is a change to the underlying software and/or application of the software) can be one way to reduce model risk. However, what about errors in the setup, data input, or interpretation of results? Beyond periodic, formal written model validations, how can decision-makers limit their exposure to model risk? Below are some key items that those involved in financial modeling should consider to aid in reducing model risk:

  • Ensure a clean audit trail for model assumptions. Whether modeling internally or engaging an outside third party to conduct modeling, key assumptions utilized (e.g., deposit pricing, prepayment speed, principal cash flows) should be easily available for review by decision-makers. Key assumptions regarding credit/default risk, interest rate environments modeled, and market rates that drive model results should be well-documented and available for review.
  • Automated does not mean “error free.” Even though many aspects of financial modeling now include a high degree of automation, ensuring that the automated inputs for financial models are being appropriately captured by the model is the first step in automation being a benefit, and not a drawback, in the financial modeling process. Additionally, if there are any new products added or changes made to existing products, those responsible for the modeling/report generation should be made aware of the changes.
  • Separation of duties. Is there sufficient separation between those taking risks (e.g., treasury, investment department or advisor, loan department, etc.) and those reporting risks? An independent third party unaffiliated with investment activity for the credit union (whether both functions occur within or outside the credit union) can be a strong control in the modeling process. The modeler should be encouraged to independently test the risk, including stressing vulnerability to expectations not coming true.
  • Modeling risk vs. plans. Planning what you expect to happen is typically opposite of the risk if things go wrong. As a result, a key part of avoiding modeling risk is ensuring that the modeling is addressing things that can go wrong, such as deposits migrating from low-cost accounts, loan balances decreasing, and credit risk increasing.
  • Apply common sense. Step back and evaluate whether the results make sense. In our experience of performing model validations, it is common to see extremely optimistic deposit values that are far beyond any price an institution would actually pay to acquire the deposits. Another example is the modeling showing huge gains on the portfolio, while the institution states that its loan rates are very competitive and the loan growth is above market. Results along these lines should raise flags about the exposure to the risk results being wrong, or if the institution feels the results are correct, additional explanation should be available.

Financial modeling should provide decision-makers with useful and relevant information to aid in the decision-making process. Ensuring that a robust system for mitigating model risk exists can help ensure the reliability of that information.

An Approach to Monitoring Liquidity

Loan growth in the credit union industry was in double-digits as of first quarter 2015.  While this is a welcome change from the flat to negative growth experienced in 2010, it can put a squeeze on liquidity if not monitored appropriately.  Liquidity monitoring and measuring is a big focus for credit unions and for examiners.  Liquidity analysis should include not just the credit union’s expected liquidity path, but also stress events and potential solutions to those events, should they occur.  Some credit unions find this a daunting task.  Here’s a suggested process to help get your credit union going:

  • Start with your plan/forecast
  • Develop a list of liquidity concerns
  • Survey key members of the organization to rank liquidity exposures
  • Create a story that captures the main exposures
  • Walk through the story and quantify potential exposure
  • Role play how the institution could respond
  • Uncover weaknesses/questions
  • Create action items to address weaknesses/questions

By walking through this process, your credit union will undoubtedly begin to think about its unique liquidity position differently.  Many credit unions uncover action items that can be implemented today to better prepare them for an unexpected future threat to liquidity.