Posts

Long-Term CDs – Questionable Cost of Funds Protection

, ,

The 10-year Treasury closed below 1.40% 3 days in July!

The flattening of the yield curve has many folks worried about further pressure on net interest margins. Some, though, are hoping to extract a benefit by locking in long-term funding at historically low interest rates. As an Asset/Liability Management (A/LM) strategy, this approach employs the trade-off between paying something more today for protection in a potential rising rate environment in the future.

The use of long-term, competitively priced Certificates of Deposit (CDs) is one common approach to achieving this goal. But there are risks in making that strategy work.

Consider a credit union offering these competitive CD rates:
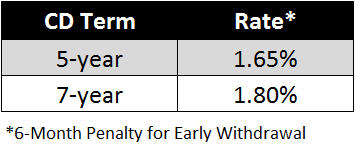
CD Term TableA member selects the 7-year CD earning 1.80% and invests $100,000. At the end of 2 years, the credit union has paid $3,600 in interest on the CD as expected. The credit union and the member are happy. Then, at the end of year 2, CD market interest rates increase by 100 bps.

How would a member be expected to react?
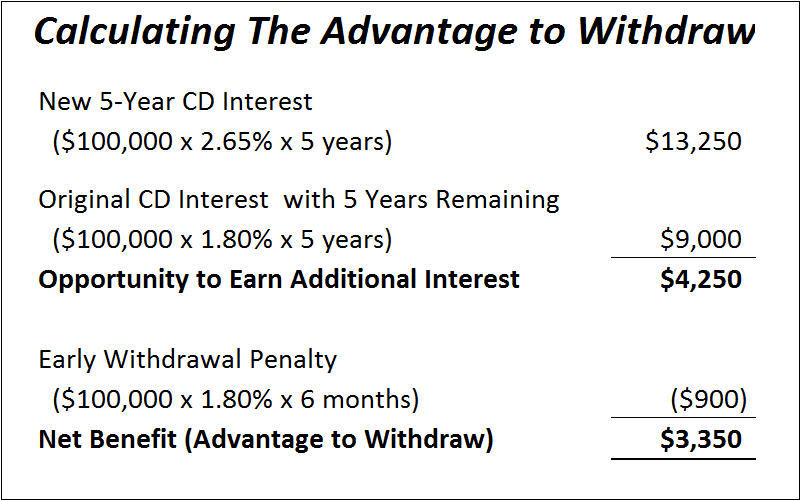
  • Calculating The Advantage to WithdrawWith 5 years remaining in the term, a comparable 5-year CD would be about 2.65% (1.65%
    from the table above plus the 100 bp market interest rate increase), versus the 1.80% currently being earned.
  • The difference of 85 bps equates to an opportunity to earn an additional $4,250 over the remaining term.
  • The member must also pay the early withdrawal penalty of 6 months interest, which equates to $900.
  • A net benefit to the member (advantage to withdraw) of $3,350 is left to pay off the original CD and reinvest in the new CD.
  • Considering the financial analysis, the member opts to pay the penalty and closes the CD.

The credit union paid the member a higher CD rate during the first 2 years for protection it did not receive in years 3-7 when CD market interest rates had increased.

Why did the strategy not work? 

The opportunity to earn more interest on a new CD when market interest rates increased greatly outweighed the penalty to early withdrawal.  This is an issue for any long-term CDs that include an option for early withdrawal.  If market interest rates become more favorable early into the life of the CD, the number of years remaining will often create a benefit that outweighs typical early withdrawal penalties.  Contributing to the issue is the flat yield curve, which means even small market interest rate increases can create a net member benefit using shorter-term CDs.

In fact, using the example above, at the beginning of the 7-year term the market interest rate would only need to go up 13 bps for there to be an advantage for the member to withdraw early.

By the end of year 2, with 5 years remaining on the CD, the rate would only need to go up 19 bps.

Consider again the 7-year $100,000 CD, and let’s look at the net benefit to the member each year if CD market interest rates changed by +100 bps or +200 bps. The net benefit is calculated simply as:

  • New CD expected lifetime interest earned (keeping the overall maturity at the original 7 years)
  • Minus the existing CD interest lost through maturity by closing the CD
  • Minus the early withdrawal penalty

In the table above, notice that when using a 6-month penalty, the member benefit is positive until the end of year 4 for a +100 bp rate increase.  This means that if the CD market interest rate were to go up by 100 bps in any of the first 4 years, the member could reasonably be expected to close the CD.  Beyond the end of year 5, in a +100 bp rate increase, the early withdrawal penalty provides a disincentive to close the CD.  Notice too, that a 6-month early withdrawal penalty leaves the member with a positive benefit through year 6 in a +200 bp rate increase.

The following tables increase the penalty by an additional 6 months each. A 12-month penalty creates disincentive after 3 years in a +100 bp rate in increase, and begins to create some disincentive after 5 years in a +200 bp rate increase. An 18-month penalty encourages the member to stay in the CD for 2 years in a +100 bp rate change.

The point is that the longer the CD, the more difficult it can be to design it to provide effective cost of funds protection in a rising interest rate environment. Typical early withdrawal penalties are not likely to be enough to make the interest rate risk strategy successful.

Credit unions may need to consider stiffer penalties for members that want to lock in a long-term investment. If the objective is risk mitigation, an option could be to have the penalty be half the term. Another option that is more complicated to explain and disclose, is to have the penalty equal to the replacement cost (present value). Each option has a trade-off and it is important to balance member perspective. An option is to have a materially lower rate with the traditional penalty and then label the more aggressive rate an investment CD (stiffer penalty). Of course, management might also consider other A/LM tools, such as long-term, non-callable borrowings, to help protect the cost of funds in a rising rate environment.

NCUA – Rethinking NEV

,

It’s no secret that the NCUA is planning to implement new guidance for net economic value (NEV) testing this year.

From NCUA’s recent open meeting, some key elements of the new guidance include:

  • Non-maturity deposit (NMD) values will be capped at a premium, not to exceed 1% in the current rate environment.
  • NMD benefit will not exceed 4% in a +300 bp rate environment.
  • NMD guidelines may need to be re-calibrated over time.
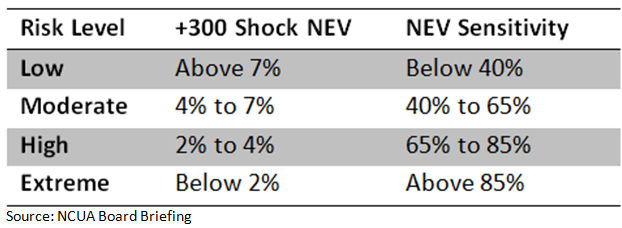
  • Risk thresholds:

NEV Supervisory Test - Risk Thresholds Source: NCUA Board Briefing

The new test is being designed to support the NCUA’s responsibility with respect to understanding risks to the insurance fund, and is intended to create greater comparability between credit unions. Credit unions will still be expected to run their own A/LM analyses, to understand risks to earnings and net worth, and support their internal risk management and decision-making.

Having modeled thousands of NEV simulations, NMD values are arguably the most significant wildcard.  For most of our clients, we already model at least two views of NEV: one using their base case assumptions for NMDs and another showing shares at par. Historically, NEV with shares at par was used by examiners to get the same comparability concept, and to limit the variety of deposit assumptions.

Shares at par ascribes no market value to the shares, thereby removing any benefit of low cost deposits from the analysis. The new guidance then, at least with respect to shares at par, would be some improvement. Keep in mind, though, that any standardization of deposit values would hide any material differences in deposit pricing between credit unions.

However, no matter how much rethinking of NEV occurs…

…NEV, even with standardized assumptions, is still not going to address fundamental business issues. For example:

  • NEV doesn’t recognize the different earnings contributions and the risk/return trade-offs that exist between assets.
    • Overnight investments earning 0.50% devalue less and perform better in NEV than a fixed-rate loan yielding 4.00%. It’s important to note that the loan contributes greater revenue in the current rate environment, as well as in a +300 bp rate environment.
    • A $10 million purchase of a new headquarters would not show any hurt to NEV results because the asset would not devalue as rates increase, but it would have an impact on earnings over a very long-term horizon.
    • Moving from mortgages to autos would reduce NEV volatility in a rising rate environment, but NEV would not show you the possible reduction in earnings power.
  • The standardized assumptions still do not distinguish between pricing for share drafts, regular shares, and money markets. Therefore, a credit union could pay 1 bp on all NMDs or 100 bps, and the NEV results would not be different. But of course, the earnings would be drastically different.
  • NEV won’t tell you if you’re making or losing money. The previous bullet is a great example of this fact. For this reason and many more, NEV won’t show you risks to profitability and if the decisions you’ve made, or are considering will cause your net worth to fall below Well Capitalized.

To sum it up, NCUA has a new test. Passing NCUA’s test does not replace the need to understand short- and long-term profitability, risks to profitability, and risks to net worth. Understanding and managing these risks are directly related to creating a relevant and sustainable business model.

Interest Rate Risk Policy Limits: One Big Misconception

,

We often see interest rate risk policy limits that rely too much on net interest income (NII) volatility and miss the absolute bottom-line exposure. Such reliance can cause boards and managements to unintentionally take on more risk than they intended. Why? Because these types of policy limits ignore strategy levers below the margin.

Establishing risk limits on only part of the financial structure is a common reason for why risks are not appropriately seen. Setting a risk limit focused on NII volatility does not consider the entire financial structure and can lead to unintended consequences.

For example, assume a credit union has a 12-month NII volatility risk limit of -30% in a +300 environment. The table below outlines their current situation and the margin and ROA they would be approving, as defined by policy, in a +300 bp rate shock.

-30% NII volatility risk limit policy vs. ROA

By definition, the credit union is still within policy from an NII perspective but because of the drop in NII, ROA has now decreased from a positive 0.50% to a negative 0.43%. This example helps demonstrate that stopping at the margin when defining risk limits can result in a false sense of security.

Not All 30% Declines are Created Equal

To punctuate the point, let’s apply the 30% volatility limit to credit unions over $1 billion in assets using NCUA data as of 3Q/2015.

On average, if this group of credit unions experienced a 30% decline in NII in a +300 bp shock, the resulting ROA would be 6 bps.

But each credit union’s business model and strategy are unique. So instead of looking at the average for this group, let’s look at the potential range of outcomes.

ROA for credit unions with assets >$1 billion
It is important to note that 46% of all credit unions with assets over $1 billion would have a negative ROA within 12 months if this volatility were to occur.

This enormous range of ROA, and with so many credit unions at risk of negative earnings, helps demonstrate that an interest rate risk limit along these lines could result in material risk with the unintended consequence of institutions being potentially blinded to the exposure of losses.

Forward Curve Back Testing

Our last blog, NEV Does Not Equal NII, drew questions from some of our readers. Specifically, some questioned our comment about a forward curve’s inability to predict interest rates. This is fair, since some in the industry seem to treat it as a foregone conclusion that a forward curve will come true.

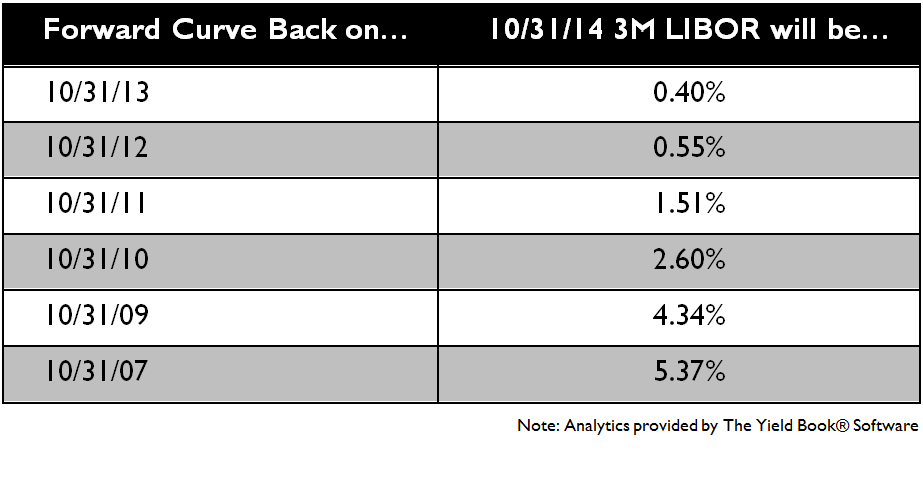
We hear a lot about back testing so let’s back test a forward curve. The table below looks at the 3-month LIBOR forward curve on the last day of October each year going back to 2007 for its “prediction” of where the 3-month LIBOR rate would be on October 31, 2014. The numbers have changed a little bit since then, but the message remains clear: a forward curve has not proven to be a good predictor of interest rates.

Back testing a 3 month LIBOR forward curve

For example, the forward curve as of October 31, 2007, “predicted” that, as of October 31, 2014, the 3-month LIBOR would be 5.37%. As of October 31, 2013, the forward curve was indicating the 3-month LIBOR to be 40 bps on October 31, 2014. The actual rate as of October 31, 2014, was about 23 bps.

Does your IRR process use a forward curve to predict rates?

Baseball legend Yogi Berra is credited with saying “It’s tough to make predictions, especially about the future.” We couldn’t agree more! Predicting rates can be good as part of the budgeting process but, when it comes to risk simulations, history has taught us that a forward curve is poor predictor of future rates. If your IRR process assumes the base rate environment will follow a forward curve, you could be missing risk. Understanding the risk of rates staying flat or not following a forward curve are lessons that should not be ignored. For this reason, we run IRR analyses that analyze potential earnings against the backdrop of all the interest rate environments including all of the yield curve twists that have happened in the last 60+ years.

COMPARISON OF INTEREST RATE RISK METHODOLOGIES

,

Interest rate risk was originally viewed as a process that should be done in a back room, resulting in volumes of information that was stored on a shelf to be available when examiners walked in. However, the complexity of the world has changed over time and so must the use of tools to help evaluate the trade-offs of decisions being faced. Institutions need to ensure they are getting answers to the right business questions in order to create a solid foundation that links strategy and desired financial performance. While there are many aspects to creating strong and sustainable financial performance, this article focuses on the abilities of the primary interest rate risk (IRR) methodologies to support decision-making.

This article was originally published as a Financial Flash by the CUNA CFO Council. The full article (Comparison of Interest Rate Risk Methodologies) can be found here.