Posts

Be Clear on Your Objective of Doing a Core Deposit Study

Earlier this week we presented at a virtual roundtable with 100+ CFOs, and one of the most common questions centered around the benefits, or lack thereof, of doing core deposit studies for use in net economic value (NEV).

It is important to study member behavior with respect to deposits, including migration, pricing strategy, and competitive and economic environments.

Below are just a few examples of this type of information for the credit union industry. It is prudent for each credit union to understand its unique patterns of member behavior.

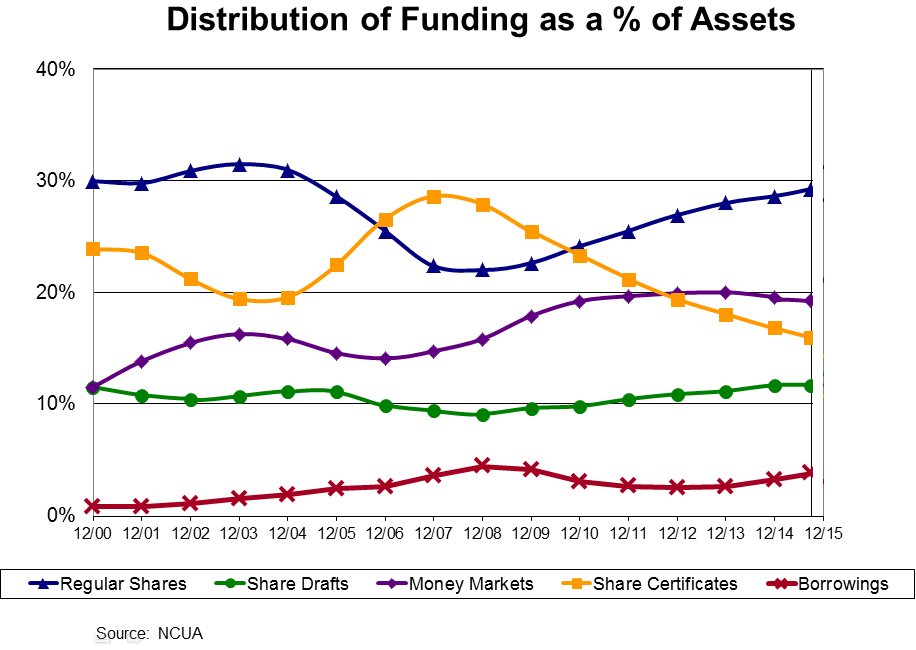
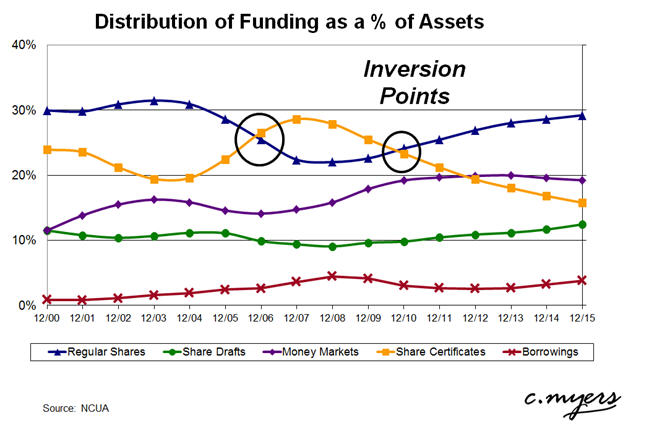
Example: Distribution of deposits has changed over time and through various economic cycles.

Percentage of Assets

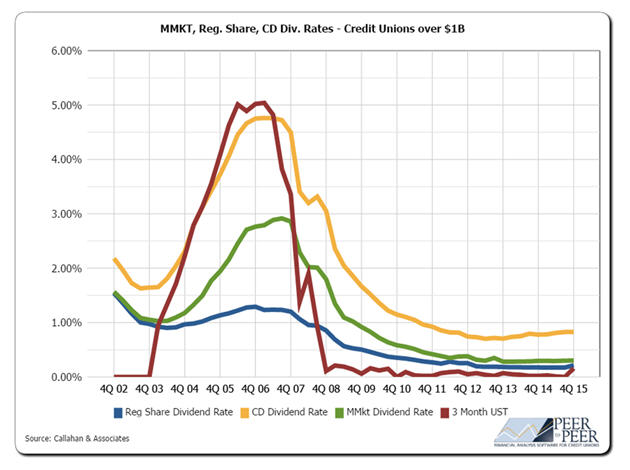
Example: Pricing strategy has changed through various economic cycles.

MMKT CUs Over 1B
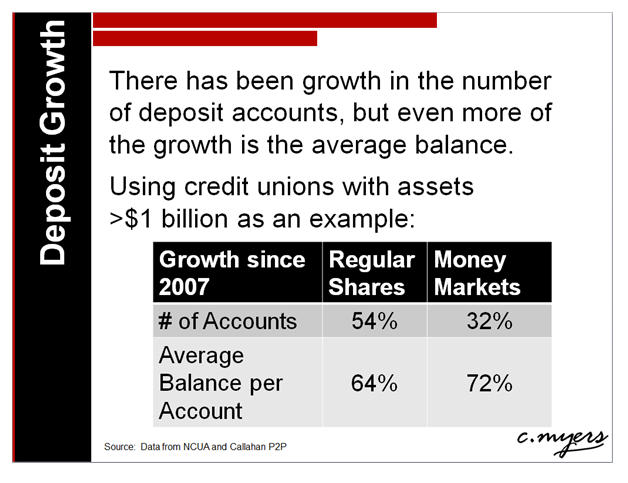
Example: Average balances relative to new accounts has changed since the last rate peak.

Deposit Growth

If you are willing to dig deeper, it is extremely valuable to understand how your deposit balances by age have changed over time ̶ a potential looming issue is that for most credit unions, large deposits are held by the older generation.

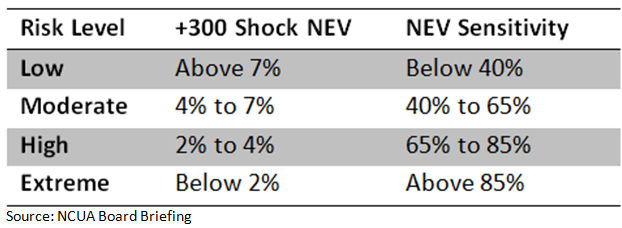
The objective of this type of business intelligence is to inform strategy. These risks can impact the credit union’s cost of funds in different environments (impacting profitability), and can be critical in identifying liquidity risks. These issues are very different than the objective of typical core deposit studies, which is to estimate decay rates and maturities of non-maturity deposits to be used most often in NEV. NCUA has released a new NEV test that standardizes the value of non-maturity deposits in the current rate environment and +300 bp shock.

So, if you are thinking about studying your deposits, be clear on your objective before spending money. If your primary objective is to use NEV, you may want to evaluate the cost/benefit in light of NCUA’s new standardization.

NCUA – Rethinking NEV

,

It’s no secret that the NCUA is planning to implement new guidance for net economic value (NEV) testing this year.

From NCUA’s recent open meeting, some key elements of the new guidance include:

  • Non-maturity deposit (NMD) values will be capped at a premium, not to exceed 1% in the current rate environment.
  • NMD benefit will not exceed 4% in a +300 bp rate environment.
  • NMD guidelines may need to be re-calibrated over time.
  • Risk thresholds:

NEV Supervisory Test - Risk Thresholds Source: NCUA Board Briefing

The new test is being designed to support the NCUA’s responsibility with respect to understanding risks to the insurance fund, and is intended to create greater comparability between credit unions. Credit unions will still be expected to run their own A/LM analyses, to understand risks to earnings and net worth, and support their internal risk management and decision-making.

Having modeled thousands of NEV simulations, NMD values are arguably the most significant wildcard.  For most of our clients, we already model at least two views of NEV: one using their base case assumptions for NMDs and another showing shares at par. Historically, NEV with shares at par was used by examiners to get the same comparability concept, and to limit the variety of deposit assumptions.

Shares at par ascribes no market value to the shares, thereby removing any benefit of low cost deposits from the analysis. The new guidance then, at least with respect to shares at par, would be some improvement. Keep in mind, though, that any standardization of deposit values would hide any material differences in deposit pricing between credit unions.

However, no matter how much rethinking of NEV occurs…

…NEV, even with standardized assumptions, is still not going to address fundamental business issues. For example:

  • NEV doesn’t recognize the different earnings contributions and the risk/return trade-offs that exist between assets.
    • Overnight investments earning 0.50% devalue less and perform better in NEV than a fixed-rate loan yielding 4.00%. It’s important to note that the loan contributes greater revenue in the current rate environment, as well as in a +300 bp rate environment.
    • A $10 million purchase of a new headquarters would not show any hurt to NEV results because the asset would not devalue as rates increase, but it would have an impact on earnings over a very long-term horizon.
    • Moving from mortgages to autos would reduce NEV volatility in a rising rate environment, but NEV would not show you the possible reduction in earnings power.
  • The standardized assumptions still do not distinguish between pricing for share drafts, regular shares, and money markets. Therefore, a credit union could pay 1 bp on all NMDs or 100 bps, and the NEV results would not be different. But of course, the earnings would be drastically different.
  • NEV won’t tell you if you’re making or losing money. The previous bullet is a great example of this fact. For this reason and many more, NEV won’t show you risks to profitability and if the decisions you’ve made, or are considering will cause your net worth to fall below Well Capitalized.

To sum it up, NCUA has a new test. Passing NCUA’s test does not replace the need to understand short- and long-term profitability, risks to profitability, and risks to net worth. Understanding and managing these risks are directly related to creating a relevant and sustainable business model.

OBSERVATIONS FROM ALM MODEL VALIDATIONS: DO DECAY RATES MATTER?

,

Yes. Decay rates do matter, but they are often not appropriately applied in the asset/liability management (ALM) process. Decay rates are essential for capturing the risk of evolving member behavior, namely deposit migration, as rates change. This blog will focus on using decay rates when simulating net economic value (NEV).

Model validations typically reveal two common issues as it pertains to the setup and implementation of deposit decay rates.

1) Decay rates are not being incorporated

Model users are often surprised to find out decay rates are not being incorporated. Common reasons for this include the fact that input fields can be hard to locate or reports summarizing key assumptions are not reported effectively (sometimes assumptions reported in a summary are not actually the assumptions in the model). To better illustrate, lack of decay rates from a recent model validation were organized by c. myers in the table below.

Decay Rates (Annual CPR) NOT INCORPORATED

The risk of decay rates not being incorporated in NEV can be dramatic, especially in the various rate shocks. If decay rates are not included, it will result in longer deposit cash flows, an unrealistic market valuation of deposits and, ultimately, an understatement of interest rate risk in a rising rate environment.

Credit unions should check their ALM models to make sure reasonable decay rates are appropriately applied and coincide with key assumption reporting.

2) Decay Rates Do Not Change As Market Rates Change

The issue of decay rates not changing as the world around us changes was discussed during a blog in September 2014. Back then, we pointed out that,

[Assuming decay rates don’t change as market rates change] is like saying non-maturity deposit cash flows will remain constant and unchanging regardless of what rates do. History shows that this is not a valid assumption and, if used, can provide a false sense of security regarding NEV results.

In the table below, c. myers organized decay rates from a recent model validation we performed.

Decay Rates (Annual CPR) STATIC AS MARKET RATES CHANGE

Notice that while decay rates are unique for the three different deposit products, decay rates remain constant regardless of changes in market rates. Said differently, this model assumes members will not consider the evolving advantage they might have to withdraw funds as rates change. However, as demonstrated in the chart below, history does not support the assumption that member behavior does not change as rates change.

The following graph shows when market rates increased from roughly 1% to 5% in 2004 and 2005, the industry experienced a material decrease in the concentration of regular shares and increase in member CDs. However, over the past 8 years, that trend has reversed as member certificates have declined while regular shares have experienced significant growth.

Distribution of Funding as a % of Assets

Keep in mind as you review decay rates, it is not about getting the “right” assumption, because that is virtually impossible. It is about reasonably representing changes in consumer behavior in your base-case risk analysis, then stress testing a range of assumptions to understand the impact.

While the focus of this blog has been on NEV, deposit behavior is a material component of income simulations as well. Ignoring deposit and member behavior will understate the cost of funds in higher rate environments and likewise hide risk. This is an issue that shows up with the static balance sheet approach and has been discussed frequently in previous blogs. To learn more, refer to the links below.

Observations from ALM Model Validations: Cost of Funds Back Testing
Observations from ALM Model Validations: Extremely Profitable New Business ROA in Static Balance Sheet Simulations
Isolating Interest Rate Risk with a Static Balance Sheet

Net Economic Value: 1 Tip on Effective Discount Rates

There are many tools that can be used to perform a model reasonableness check, or a model validation. Below we share a simple “sniff test” to help credit union CFOs and financial analysts assess one key assumption driving net economic value results, the effective discount rate applied to each loan category.

Tip: Compare the effective discount rate in the current interest rate environment to the applicable loan portfolio yield. Understand the reasons for material differences.

You might be thinking – “Why do I need to see the effective discount rate in the current environment if I can see the values?” Well, how do you know if the starting value is reasonable?

Seeing the assumed effective discount rate and comparing it to the loan portfolio yield would help you think in terms you deal with every day. For example, if you could see the weighted-average yield of your auto loan portfolio has been holding steady at about 5.50% yet the assumed effective discount rate in the current environment is 2.75%, you would probably want to understand why there is such a disparity. You begin asking questions.

Are we charging our members above market rates? If not, what might be the reason that our yields are so much higher than market? Do we accept a higher than typical credit risk? Perhaps insufficient credit spreads are being applied to the assumed discount rate.

Are there other unique lending practices that we perform that might account for higher than market yield in our portfolios? For instance, if your mortgage rates are materially higher than the effective discount rate, dig deeper. Maybe your mortgage loans are non-conforming and the discount rate has not been adjusted appropriately. Ask yourself why a purchaser of non-conforming loans would not want to be appropriately compensated for a potentially higher risk and less liquid asset.

Even if your ALM model touts that a unique spread is being applied for every single loan, you should still step back to determine the reasonableness of these assumptions and understand the overall portfolio effective discount rate for the current interest rate environment relative to your portfolio yield.

Performing this quick reasonableness test helps bring a common sense approach to values and ultimately NEV results.

Observations from ALM Model Validations: Optimistic New Volume Rate Assumptions

When running static or dynamic balance sheet income simulations, assumptions regarding the interest rates received on new business are needed. On the surface, this seems to be an easier assumption to make relative to some of the other assumptions needed in asset/liability management modeling (ALM modeling). However, in model validations we have performed, we have seen several issues with this assumption that result in far reaching consequences on the modeling.

For example, most credit unions tout that their rates are better than bank rates. Assuming new production at lower rates can make sense from an earnings and risk to earnings perspective.

The challenge is that many will assume that their net economic value (NEV) discount (market) rates are the same as their new production rates. To represent the fair value of assets (NEV), it is important to represent the yield that the market would demand to purchase the loans from the credit union. Assuming a low discount rate creates optimistic market values. Therefore, it is necessary to increase the discount rate to make the NEV more reasonable.

A Modeling Challenge
While, in this example, increasing the discount rate helps to produce more reasonable NEV results, it creates more optimistic earnings projections because quite often institutions use the same assumption for both new production and NEV discount rates.

One Solution
If your credit union is running a model that uses offering rates as discount rates, and any adjustments to the offering rate affects both the income simulation and the NEV, consider doing two different model runs—one for the income simulation with new volume rates representative of recent production and one for NEV with the adjusted discount rates.

Rates Change
One other consideration is the new volume rate in shocked rate environments. The most common assumption seen is that loan rates will go up 100% of the rate change and the rate increase will not hurt new volume production. Considering that the industry has been experiencing significant loan growth, resulting in an increased loan-to-asset level; is it reasonable to assume that current levels will be maintained (or assumed growth continued) despite taking all loan rates up 300 bps?

Competitive forces may not allow pricing to move this fast. Consider adjusting the base case to incorporate a slower pricing change. If not making this assumption in the base, minimally run a what-if scenario to understand the sensitivity of the results to the assumption.

Events

Nothing Found

Sorry, no posts matched your criteria