Posts

Observations from ALM Model Validations: NEV – Loans Devalue in Rate Shocks – or Do They?

When considering valuation as a measure of interest rate risk, and value volatility as an indicator of changes in interest rate risk, many institutions perform net economic value (NEV) analysis. When working with credit unions, or performing model validations, a concern many have is ensuring the models have the “right” assumptions. What is the “right” discount rate? Should credit risk spreads be incorporated? What effective discount rate or what yield curve should be used to discount cash flows – which method is “more right”?

All of the above may be questions to consider but they are distractions from simple analyses credit union management teams can perform when determining if answers are reasonable. For example, take an auto loan portfolio in which the valuation methodology derives a value of $210M in the base rate environment. This same portfolio devalues to $200M in a +300 bp shock. Said differently, the value volatility in a +300 bp shock is -5.00%. From a quick reasonableness test, this is within a 4-6% devaluation range in a +300 bp shock – very reasonable for an auto loan portfolio.

However, does it change the reasonableness answer if the current book value of the auto loans is $199M? While the devaluation of the loan portfolio is certainly reasonable, the resulting answer implies that the loan portfolio could be sold at a 0.50% gain if rates increased 300 bps instantly. That answer is certainly less reasonable. It is important to remember, in Chapter 13 of NCUA’s Examiner’s Guide, NEV is defined as the fair value of assets less the fair value of liabilities. Would it be reasonable to assume a fair value gain on an auto loan portfolio if rates increased 300 bps?

When measuring NEV volatility, the starting value still matters. High starting values can be driven by low starting discount rates. It is good to evaluate both the effective discount rate and the difference between value and book in the current environment. Some models are unable to calculate an effective discount rate. We have found that sometimes in this situation the effective discount rate does not match what the user intended. If you are in the situation of the model not being able to show the current discount rate, extra attention should be given to the value versus book and how the value compares to book in different environments. Optimistically high starting and shocked values can hide risk and volatility; this connects with the cautions brought out in our blog regarding high starting NEV ratios posted on September 25, 2015.

Observations From ALM Model Validations: High Starting NEV Ratios

When performing model validations, it is common to see a net economic value (NEV) ratio that is considerably higher than the credit union’s current net worth ratio. Understanding NEV and net worth are two completely different concepts; there are reasons why starting with a high NEV ratio in the base environment may not be reasonable.

First, let’s discuss some of the reasons why this can occur:

  1. Non-maturity deposits are assumed to have long average lives. Given the positive slope of the yield curve, this assumption results in higher discount rates and optimistic market value premiums
  2. The credit union does not incorporate transaction spread costs when valuing deposits, which overstates the value to the credit union
  3. Optimistic loan discount rates, that ignore credit and other market risks, results in overly optimistic loan market values

Consider that NEV is intended to show the fair value of a credit union. Therefore, mergers can be used as a reasonableness check of this critical component of modeling. Mergers over the last several years do not support the assertion that an acquiring institution would pay a significant premium to the net worth.

It is important to understand that optimistic base NEV results also impact volatility ratios in various rate shocks. To keep the math simple, consider a $100 credit union performing NEV with two different sets of assumptions. For example purposes, the dollar volatility in a +300 basis point (bp) shock is assumed to be the same while, in reality, the more optimistic assumptions in Assumption B would result in a lower dollar volatility.

Model validations with high NEV ratios inaccurately predict volatility

Many have said that the reasonableness of the starting NEV doesn’t matter; it is the volatility that should be the focus. Notice that while the two sets of assumptions in this example have the same dollars of volatility in a +300 bp shock, the percent volatility and NEV ratio in a +300 bp shock are dramatically different. The NEV in Assumption A may be considered high risk, while the NEV in Assumption B may be considered low to moderate risk.

If using NEV, credit unions should focus not only on NEV volatility but should also understand what their base NEV ratio is showing and if it is reasonable. If the starting NEV ratio is considerably higher than the net worth ratio, the credit union needs to understand why. If it is not defendable, credit union management should consider making adjustments to assumptions.

NEV Does Not Equal NII

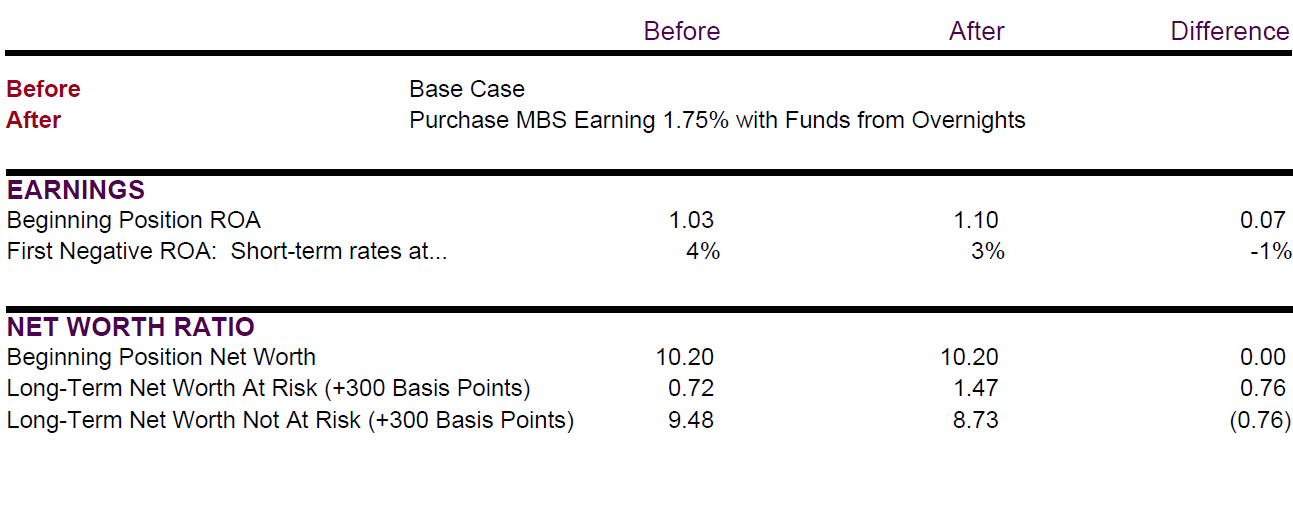
Some in the industry say that net economic value (NEV) is an indicator of future earnings. Let’s test this out by modeling a credit union taking $30 million of funds that are currently sitting in overnights earning 0.25% and investing them in mortgage-backed securities earning 1.75%. Even without a model, we know that net interest income (NII) will increase; however, as we model the scenario, we will look at both the earnings and the NEV to see how they have changed from the base case.

The income simulation results below show that the credit union will be poised for higher earnings if it purchases the MBS and will increase its interest rate risk in a rising rate environment.

Income simulation for purchasing MBS

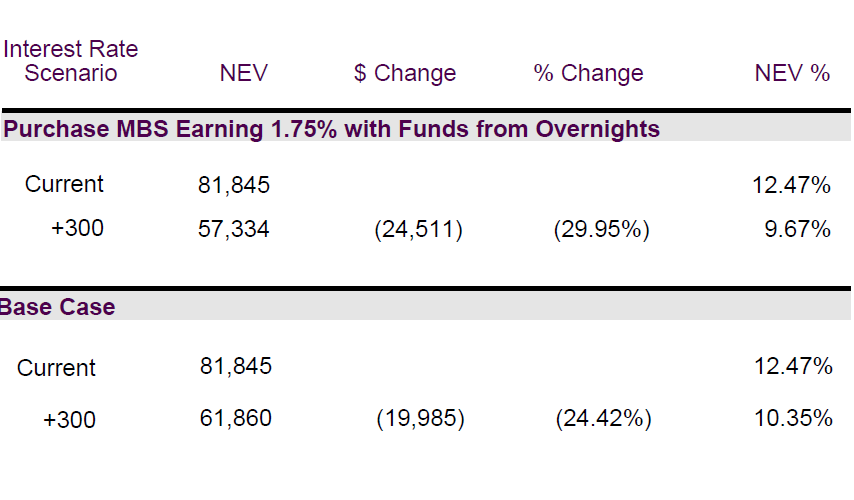
If NEV is an indicator of future earnings then one would likewise expect to see an increase in NEV in the current rate environment.  NEV results are shown below:

NEV unchanged by MBS purchase

Notice that the current NEV is unchanged. The credit union would be poised for higher earnings in the current environment if it purchased the MBS, so why didn’t the NEV increase?

Funds sitting in overnights are at par and, on the day the MBS is purchased, its purchase price is its value. In other words, $30 million sitting in overnights is worth $30 million and $30 million of MBS is worth $30 million. Therefore, the current NEV will not change.

The theory that the NEV will represent the future earnings is hard to defend and it misses key aspects of decision-making.

Some have tried to defend this concept by saying that the forward curve will predict future rates; the problem is that it has never done this consistently and has not done this at all over the last decade. If the forward curve were to accurately predict the future, the theory would indicate that the earnings of the overnights will equal the earnings of the MBS in the base rate environment. If decision-makers played this concept out, it would tell you that over time there is no reason not to have all of the credit union assets in overnights. Such a strategy doesn’t make sense.

From a business perspective, understanding the timing of earnings is one of the key questions to answer for decision-making. NEV does not help decision-makers see the timing of the earnings, nor does it answer many of the other key business questions (for more on key business questions, please refer to our c. notes titled Comparison of Interest Rate Risk Methodologies).

Key Business Questions

,

When credit unions evaluate changes in strategy or financial structure, the focus from an A/LM perspective is often on valuation and net interest margin.  However, these traditional approaches to measuring risk will not answer several critical business questions.  Consider, does NEV or net interest income analysis allow a credit union to see:

  • Under what rate environments could the decisions we have made and implemented cause us to have materially reduced or negative earnings?
  • Under what rate environments could our existing business cause us to no longer be Well Capitalized from interest rate risk?  How does the answer change as other risks are aggregated?
  • What does our new business need to earn going forward in order to achieve our net worth and asset size goals and offset existing risks?
Key components of risk will be missed in the analysis process if there is not a consistent focus on understanding long-term, bottom-line profitability, as well as incorporating the aggregation of other unexpected events.  Remember your credit union only puts net worth dollars at risk through bottom-line negative earnings.  Do your A/LM tools allow you to see when negative earnings could occur, and when they do, what the magnitude could be?  If not, consider what risks might be missing.

Evaluating Derivatives―Part II: Economic Value

In a previous blog, impact to earnings was discussed as it relates to derivatives and the insurance they can provide against a rising rate environment. While derivatives can be a good option for hedging interest rate risk, especially in today’s low rate environment, it is also important to consider how economic values are determined.

Because of the complexity of this topic, there will be a series of blogs so that we can keep them relatively short.

On day 1 of a swap transaction, the swap’s economic value will be zero, meaning the economic value will not reflect a gain or loss in the current rate environment. This value will change over time even if rates don’t change.

Why is the beginning base economic value zero? The present value of expected cash flows for both the fixed-rate party and the floating-rate party are assumed to be equal.

Using the swap example in Part I:  Earnings, the party paying fixed starts with a large negative cash flow. In order for the present value of cash flows to be equal, the pay-fixed side would need to have positive cash flows at some point in the future.

For the example swap (pay fixed 2%), the math indicates that short-term rates would need to go up about 300 bps before the swap matures in order to offset the present value of the initial negative cash flow.

Implied Cash Flow GraphDerivatives analytics provided by The Yield Book® Software.

The expectation that rates go up needs to be understood since the results would be quite different if the implied rate path does not come true. This critical consideration will be addressed in more detail in future blogs.

We will also address questions such as:

  • How do the value results differ from actual earnings?
  • What could cause the values shown to not come true?