Posts

Too Much Loan Growth?

, ,

Many credit unions have had the good problem of being so successful in lending that liquidity has become a challenge.  A blog we wrote in December 2016 identified 6 key questions that decision-makers should evaluate on the issue.  This post expands on that topic by looking at several possible liquidity solutions credit unions are considering as they deal with tightening liquidity, and what the A/LM implications of each scenario would be.

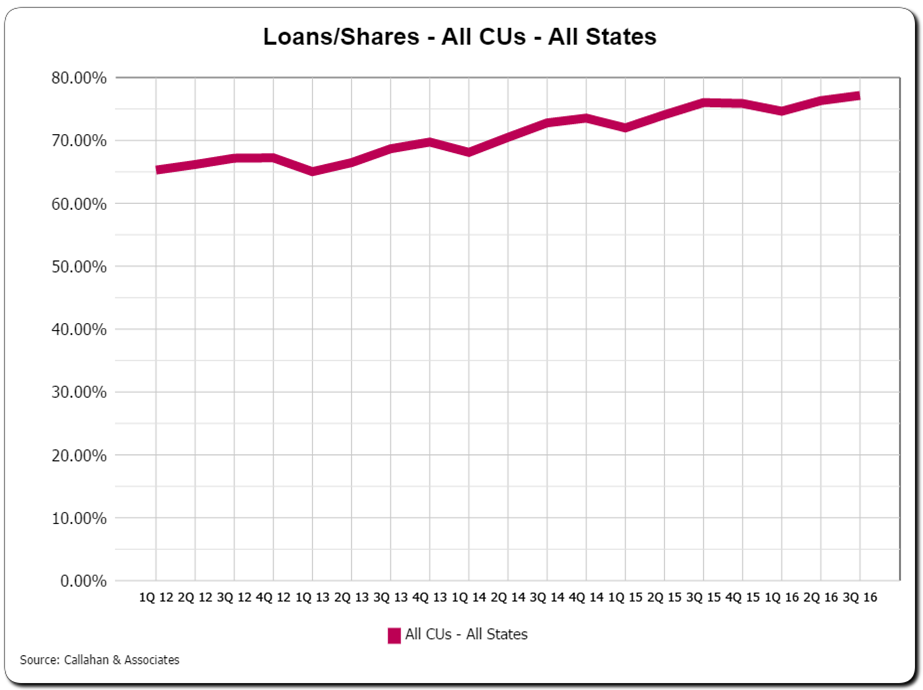
So how did we get here?  The average loan-to-share ratio for credit unions has increased by almost 12% over the last 4 years as loan growth has steadily outpaced deposit growth.  The average loan-to-share ratio now stands at almost 80%, while many individual credit unions have seen their loan-to-share ratio increase well above that level.

17-02-mac-blog

As liquidity has tightened, some credit unions have turned to selling or participating out loans as a way to manage short-falls in funding.  However, many of those same credit unions are finding that selling or participating out loans at favorable terms has become increasingly difficult, and that trend could continue.  If the economy strengthens, financial institutions would likely see loan demand remain strong, which could further hamper an ability to sell loans.  Why would another credit union or bank buy loans from your institution, if they can originate loans on their own?

One solution could be to slow down loan growth by raising rates.  However, credit unions are initially reticent about this path if other viable alternatives are available due to fears about getting growth ramped up again, especially for institutions that do a lot of indirect or commercial loan business.

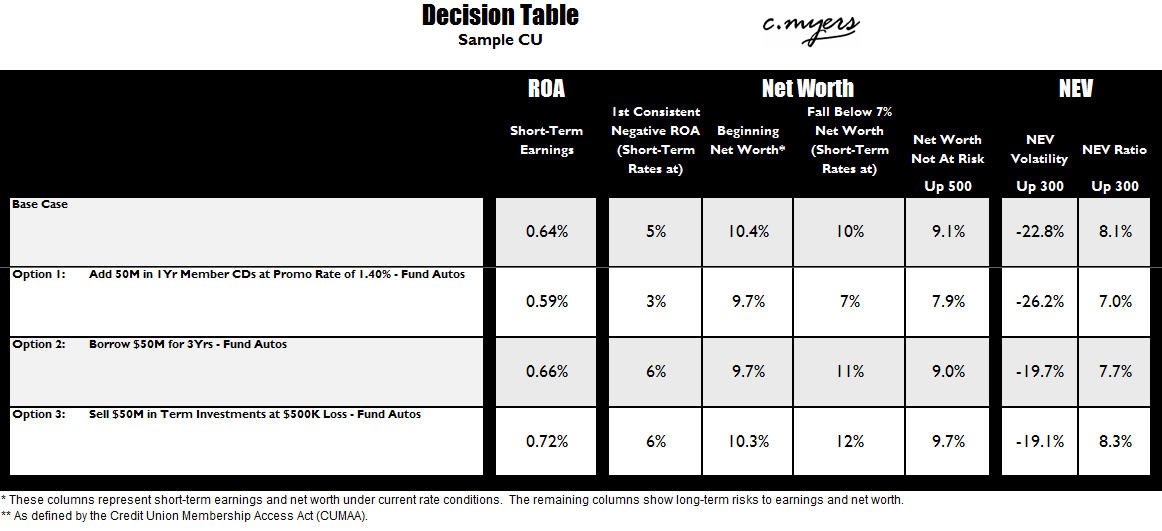
While there are important strategic and budgetary considerations that should be evaluated, the A/LM impact should not be forgotten.  Below are examples of liquidity funding scenarios that credit unions are testing with some frequency.  In each scenario, the credit union is adding $50M in auto loans, while evaluating 3 distinct funding strategies.  Additionally, in these scenarios the credit union has assumed it has the internal capacity to make these loans without the need for increased operating expenses.

Member CD Promo

For many credit unions, the first option to attract liquidity would be to get it from the credit unions’ members.  The first option (see Option 1) looks at the impact of solving the liquidity challenge through an aggressive CD promotion (1-year term at 1.4%).  A challenge with the member CD solution is the likelihood of cannibalizing lower cost deposits as members take advantage of the higher rate.  Additionally, funds acquired through CD promotions could be rate sensitive if opportunities develop for the member to obtain a higher yield.  Both of these risks were factored into the modeling.  The results show that adding autos and funding with short-term CDs (including transfers from lower-cost deposits) would negatively impact ROA today compared to the base case, as well as increase risks to earnings and net worth if rates rise.

17-02-mac-decision-table-image

Intermediate-Term Borrowing

The credit union could also evaluate an intermediate-term borrowing strategy (Option 2).  While borrowing at a fixed rate for 3 years is more expensive than short-term borrowings, it can help reduce risks to earnings and net worth if rates rise.

If borrowings are utilized, there are other questions to consider.  For example:

  • What internal borrowing limits might your credit union have in place?
  • Are there any regulatory constraints on your planned borrowing strategy, and how much would you have remaining in available lines of credit in the event of a liquidity emergency?
  • Would your credit union plan to increase available lines of credit in the future? If so, the type of loans being added would matter.  For instance, consumer loans are not as readily collateralized as mortgages.          

Selling Investments

The final strategy (Option 3) looks at selling investments to fund the same $50M in loan growth and assumes the investments are sold at a 1% loss.  Setting aside the slight decrease in the net worth ratio, the results of this scenario look the most favorable with improvements in ROA and the risk measurements.  However, this solution could raise a different set of questions.  For example:

  • Are the investments that were sold being used as borrowing collateral?
  • If they were borrowing collateral, how would this impact future liquidity options and is it a sustainable strategy?
  • What kind of gain/loss would there actually be if investments were sold?

Whatever the solution, it is important to look beyond just the next couple of quarters.  If loan sales remain challenging or loan growth continues to outpace deposit growth, what is your credit union’s long-term liquidity management strategy?  Consider playing this out over the next 12 months, think through the tough strategic questions, consider the impact to your budget/forecast, and make sure you play out the results from an A/LM perspective.

Finally, if it is determined that there are limits to the amount of loans the credit union can book going forward, does the credit union have the tools that allow you to see the complete risk/return picture of your different asset categories to determine which have the most favorable risk/return trade-offs?  Armed with that information, your credit union could work to maximize the growth in the most favorable loan categories, while perhaps reducing emphasis on those categories that are less favorable.  Our clients have reporting that allows them to comprehensively evaluate the risk/return trade-offs of individual loan categories.  We wrote a c. notes on this topic in 2016.


Focusing on Branch Profitability, Solely, Misses the Mark: 4 Things to Consider

, ,

As consumers’ preferences continue to evolve, it is becoming painfully clear that focusing solely on branch profitability will provide an incomplete or even misleading picture for decision-makers.

Think of it this way.   Traditional branch profitability analyses often reward branches for living off the past. 

Consider a branch that has a large loan portfolio, creating a lot of revenue, ultimately leading to today’s high ROA for that branch.  However after taking a closer look, it may turn out that this branch hasn’t produced many loans over the past year.  In fact, they are one of the lower ranked branches in terms of loan production.  However, the high ROA shown in a traditional branch profitability analysis is the result of living off loan production from years ago.

Evaluation in terms of current ROA alone may result in missed opportunities to realign resources today in order to have intentional focus on strategic objectives and evolving trends.

The following outlines 4 things to consider that is guaranteed to enhance business intelligence with respect to delivery channel effectiveness.

1.  Expand the evaluation to all delivery channels.  Credit unions are investing heavily in self-service options for members.  Effective adoption of these options is key to remaining relevant for many credit unions.  A focus during on-boarding has proven to help with adoption and engagement of new self-service options

2.  Align measures of success for each delivery channel with the credit union’s strategy.  This requires decision-makers to be intentional about the purpose of each branch, the contact center, and digital delivery channels

3.  Take a holistic approach to metrics.  Rank them to align with the credit union’s strategy.  For example:

  • Membership Growth
    • Not all growth is created equal.  This can be evaluated by segments if there is a strategic emphasis on the type of membership growth
    • Assigning indirect autos to the closest branch can significantly skew results.  Consider evaluating and managing the indirect channel as a stand-alone delivery channel
    • The same holds true for membership acquired digitally.  If a branch is credited, decision-makers will not have clarity with respect to the effectiveness of their digital delivery strategy or the physical branch
  • Value-Add vs. Routine Transactions
    • Work with your team to distinguish value-add from routine transactions, then rank delivery channels accordingly.  For example, many are revamping branches to remove routine transactions so that value-add and complex transactions can be effectively and efficiently handled.  In this case, the metric would evolve around reducing routine in-branch transactions and increasing value-add transactions
  • Member Engagement & Feedback
    • Comprehensive delivery channel evaluations should incorporate what the members are saying about their experiences with the different touch-points.  Credit unions are investing heavily in digital delivery.  It is not uncommon to hear that member satisfaction with digital delivery is lower than that provided in branches.  If this is true for your credit union, ask yourself how this can impact member engagement and how the gap in member satisfaction can be narrowed
    • If the credit union has strategic emphasis on particular demographic segments, consider establishing metrics that align with this focus
  • Loan Growth
    • Rank current balance, short-term, intermediate-term, and long-term performance independently.  This addresses a common flaw of profitability studies that can focus too heavily on older loans
    • Rank major segments of lending by balance and recent production.  This provides an early warning if production is falling off
  • Share Growth
    • Consider category evaluations.  Delivery channels that rank high for regular shares or checking may benefit the credit union differently than those with a heavy reliance on money markets or CDs

4.  Weighting Is Key

  • Each of the above can be important to monitor, but not all of them will contribute equally to the credit union’s performance or strategy.  Consider the credit union’s strategic objectives and then use these objectives to help weight the importance of each category.  This intentional view of production and member experience, connected to strategy, creates better business intelligence for decision-makers than a traditional branch profitability analysis

Having a broader understanding of delivery channels in terms of contribution to strategic objectives and the trends exhibited is the first step.  This can then be combined with profitability estimates if desired.

As the financial services industry becomes more complex, it is important for decision-makers to have the right type of business intelligence so they can take action and make necessary course corrections, timely.

NEV: Things to Remember

Net economic value (NEV) will not show you the effect on current earnings when testing risk-mitigating strategies.

To illustrate, assume a credit union concerned about its interest rate risk is considering selling all of its 30-year, fixed-rate, 1st mortgages. The credit union plans to put the proceeds into overnights to give themselves the best hedge against rising rates. As part of the credit union’s decision-making process, a “what if” is run off the most recent NEV analysis. After reviewing the results of the “what if,” the decision is made to sell the mortgages. Why?

As indicated in the table above, the “what if” shows that selling the mortgages today does not hurt the starting NEV, but it does help NEV if rates increase 300 basis points (bps). The decision was a “no-brainer” for the credit union.

The reason the results look like this is that NEV is the fair value of assets less the fair value of liabilities. In the current rate environment, the base case NEV results already included the small loss the credit union expected to take upon sale of the mortgages. That total sale price would be invested into overnights (at par). In a +300 bp rate change, the base case NEV results included the devaluation of the mortgages. However, in a +300 bp environment, overnights are still valued at par. So the “what if” results showed that there was no change to the current NEV, and in a +300 bp rate change, it showed less risk.

What about the earnings trade-off? Selling all of the credit union’s mortgages and putting the proceeds into overnights does help its risk in a rising rate environment, but at the cost of over 100 bps in ROA today. Using NEV as the primary decision-making tool did nothing to show the credit union the “risk-return trade-off.” NEV also will not help the credit union answer the question: “after selling the mortgages, how high would rates have to go before reaching a breakeven point from an earnings perspective?”

Callables and Low Rate Environments

Trying to get any kind of yield on investments is tough when rates are this low. Some credit unions are reaching for yield by purchasing longer-term callables with the justification that “we don’t have to worry much about the risk because they are going to get called.” But consider this, if rates move up even a little bit, most callable bonds will not get called, and the credit union could be stuck with material losses. The example table below demonstrates this potential risk.

The example assumes that a $1M 1/5 callable (callable in 1 year, final maturity in 5 years) is purchased today at 80bp. It shows that, compared to Overnights earning 25bp, this investment would yield an additional $6K in revenue over the course of 1 year, at which point it would be called. However, when you layer on industry-average cost of funds, operating expense and fee income, it reveals that from an ROA perspective this investment loses $19K in year 1. If rates go up at all, the bond will stick around for the full 5 years, and in a +300bp rate environment the bond would lose about $147K over its lifetime when the credit union cost of funds, operating expense and fee income are factored in. If rates returned to levels seen in 2007 (5%), this bond would lose $190K over its lifetime.

Note that for simplicity sake it is assumed that rates move immediately.

Some credit unions can afford to take this risk, some cannot. In any case, the decision to buy longer-term callables should NOT be based solely on the expectation that they will be called; the consequences of being wrong could have a very negative impact on a credit union’s risk profile and future earnings.

Setting Board Expectations

,

Setting board expectations has always been key.  However, it is increasingly important as many credit unions are seeing their ROA jump—largely due to falling provision ratios.  Over the last two years, the industry average PLL has declined from its peak of just over 1% in 2009 to about 0.50% as of the first quarter in 2011 (see graph A below, Source NCUA, FDIC).  The decrease in PLL has been the single biggest reason that the industry average ROA has increased since its low in 2009 (see graph B).

While this has been great for the industry, the question is, how sustainable is the decline in PLL? In many cases, the decline is not sustainable as credit unions are running a provision that is below “normal” levels or reversing accruals to ALLL that they believe to be excessive (see post Planning for PLL).  This means the current ROA is temporary, as it will decrease once the provision returns to normal levels.

Management teams need to communicate this to their board and set the expectation that their financial position will be different going forward.  This will help prevent misunderstanding between the board and management and ensure that the two groups continue to work together to position their institution to be stronger in the future.

Table A:


Table B: